Christopher S. Cali
Student Development Coordinator at MHC & Student at GC
-

-
-
-
-
Chris Cali Portfolio
UPDATE: View my Tableau story here for a more visually stimulating experience of the project.
BELOW IS THE ORIGINAL ITERATION OF THE PROJECT FIRST PUBLISHED 11/7/21
Research Question
When the pandemic started, […]
-
-
-
Chris Cali Portfolio
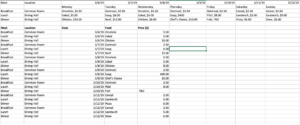
For first portion of this lab, we manually cleaned the data. CSV file linked here. Screenshot below from my manual cleaning work:
Second portion of Population Data screenshots below:
-
-
-
-
-

-

-

-
-

-