Nicole Baz (she/her)
-

Nicole Baz Visualization and Design
NYC Noise Complaints & Punitive Action in 2023
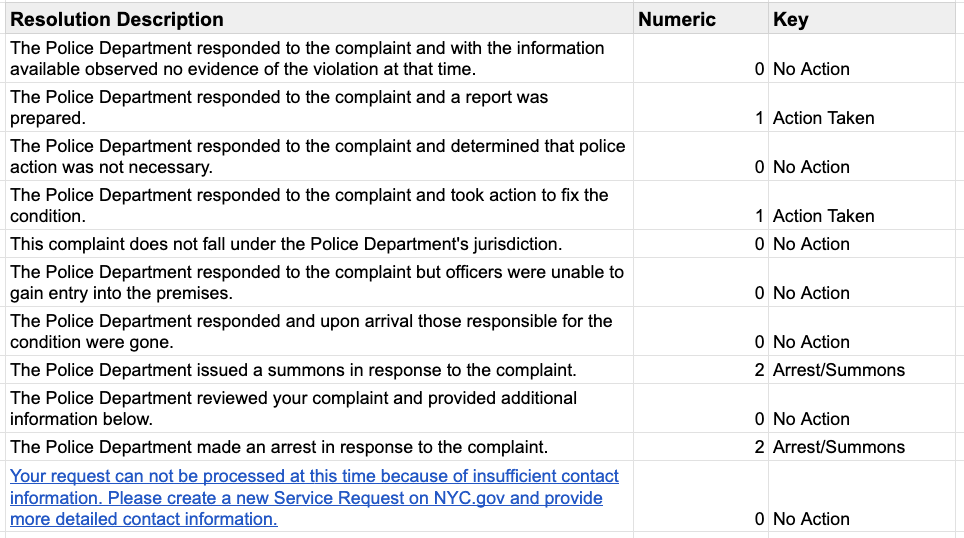 DATA 73000 Project #1: 311 Data Nicole Baz, Spring 2024 Guiding Research Questions: How many loud music/party noise complaints resulted in punitive action from NYPD in 2023? Are there any relationships between location and time that result in more arrests? Key Audience: NYC Residents and community members can benefit from this project as it reveals arrest patterns by the NYPD in response to loud music/party complaints made by other New Yorkers. Complaints Summary These visualizations show “Loud Music/Party” noise complaints by month and by borough. With these visualizations you can: See a zoomed out look at all NYC party noise complaints by month Use the pie chart to look at the borough breakdown by month to see where the complaints are being made from. WHERE are arrests happening? While borough is a useful way to group complaints, this visualization offers exact complaint locations. There is a helper table to view percentage breakdowns by borough and police response type. With these visualizations you can: Use the Police Response filter to toggle between the different response options (No Action Taken, Action Taken, or Arrest/Summons). See complaints grouped by location type to highlight any patterns. Filter between NYPD response type to see any patterns in location that arise. Drill down into a specific borough using the Borough filter WHEN are arrests happening This line chart shows time of complaint (by hour and by borough), and accounts for all complaints in 2023. With this visualization you can: See patterns in time of day for party complaints Drill down into NYPD response to see how patterns change between hour and borough. Data & Design Rationale Data The data for this project was sourced from the NYC 311 Open Data platform, specifically the 311 Service Requests from 2010 to Present data explorer. Using the Query tool, I exported service requests from 12am on 1/1/23 to 12am on 1/1/24 that used the descriptor “Loud Music/Party.” This amounted to 353,547 cases. To support the included visualizations, I had to create the following calculated fields: Functional Time – This string variable allowed me to get the time of the complaint grouped into hours (i.e. 1pm) rather than down to the second. Police Response – I coded the following “Resolution Descriptions” from the 311 Data to streamline the visualizations. Design Rationale I chose to start the journey of exploration of this data zoomed out – with basic summative charts. The bar chart serves as a quick way to viewers to glean total noise complaints throughout the year by month. It seemed a natural next step to see this information by borough as well. Viewers have the option to view the whole year by borough or drill down into a specific month of interest. Next, I wanted to explore specific locations of noise complaints via a map visualization. Given that the data provided a Location Type variable, I chose to split out the complaints by location type to both see patterns in the data but to also make the map more readable (as mentioned, there were > 300,000 data points). This chart is most useful when viewers are able to view just the Arrest/Summons cases. In support of this, I included a summary table to help viewers get a sense of percentage of Arrest cases vs typical cases (no action taken or action taken). Finally, I chose to drill down into the Arrest/Summons cases by time of day and borough. The line chart compares borough to borough over a 24 hour period, and aggregates all complaints made throughout 2023. This final visualization fills in the missing piece of the puzzle, the “when.” You can view all vizzes together here. Next Steps Moving forward, I would continue to use visualizations to help identify patterns in arrest/summons cases. Further exploration could be done by using cross streets, police precincts and other variables to identify patterns of arrests in even more specific areas of NYC. It would also be interesting to fold in external socio-economic data to see if arrest trends correlate with other variables […] “NYC Noise Complaints & Punitive Action in 2023”
 -